
Our website uses cookies to enhance your browsing experience.

At some moment, long ago, we somehow started to cover in our articles any subject but the PVS-Studio tool itself. We told you about the projects we checked and the C++ language's subtle details; we told you how to create plugins in C# or how to launch PVS-Studio from the command line... But PVS-Studio is first of all meant for developers working in Visual Studio. We've done quite a lot to make it easier and more comfortable for them to use our tool. Yet this particular aspect usually stays off screen. Now I decided to improve that and tell you about the PVS-Studio plugin from scratch. If you are a Visual C++ user, this article is for you.
We invite you to check out an updated version of this article, in which some of the new functions of the analyzer are presented.
Static code analysis is the process of detecting software errors and defects in the source code of computer programs. Think of static analysis as an automated code review technique. Joint code review as such is a wonderful method, but it has one crucial drawback - a high cost. It's expensive because you have to gather together several programmers regularly so that they could review a new code or re-review a modified code.
On the one hand, one wants code review to be done regularly; on the other hand, one can't afford it. Static code analysis tools are a compromise solution. They can check tons of source codes without getting tired and give recommendations to the programmer about which code fragments should be given special consideration. Static analyzers will certainly never replace a good code review performed by a team of programmers, but the high ratio usefulness/price makes static analysis a very helpful methodology adopted by many companies.
There are many commercial and free static code analyzers. A large list of them can be found on Wikipedia: List of tools for static code analysis. The number of languages supported by static analyzers is also very big (C, C++, C#, Java, Ada, Fortran, Perl, Ruby, ...). In this article we are going to discuss the PVS-Studio analyzer, of course.
What makes static analysis so valuable is that it can significantly reduce the cost of eliminating defects from the program code. The earlier a bug was found, the cheaper it is to fix it. According to the book "Code Complete" by S. McConnell, fixing an error at the testing stage is ten times more expensive than at the code writing stage:
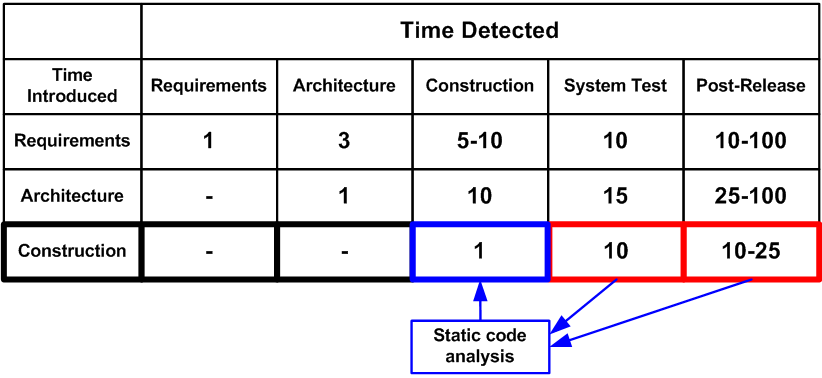
Figure 1. An average cost of error fixing depending on the time the error was added into the code and the time it was detected (the figures for this table are taken from the book "Code Complete" by S. McConnell). Click on the picture to enlarge it.
Static analysis tools allow one to reveal many errors that appear at the code writing stage, which makes the development of the whole project much cheaper. For example, the PVS-Studio analyzer can run in the background right after compilation and report any potential bug to the programmer. I'll tell you about this mode in detail a bit later.
The subjects of code review and static analysis are discussed in detail in the articles found by the links in the References section [1, 2, 3].
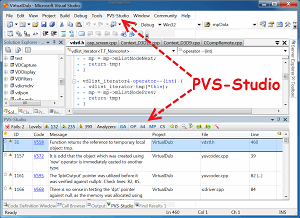
PVS-Studio is a static analyzer for detecting bugs in the source code of applications written in C, C++, C++11, C++/CX. First of all, it is designed for Visual Studio users (see the product page for details about supporting other IDEs). The analyzer integrates firm and smooth into any version of the environment within the range VS2005 - VS2012. We're also adding support for VS2013 soon. Once the tool has been integrated, users will see a new item "PVS-Studio" in the main menu and a window where to handle diagnostic messages generated by the analyzer (see Figure 2).

Figure 2. The main elements added by the PVS-Studio analyzer plugin after integration into Visual Studio. Click on the picture to enlarge it.
The analyzer is ready for work right after installation. In most cases it won't require you to customize anything before the first run. The only option you may need in the very beginning is that of excluding third-party libraries from analysis: you won't change anything in the source codes of the jpeg library anyway - so, no need to check it. Besides, excluding some folders from analysis will reduce the analysis time. To specify the folders you want to exclude from analysis, go to the following settings window: Options->Dont't Check Files->PathMasks (see Figure 3).
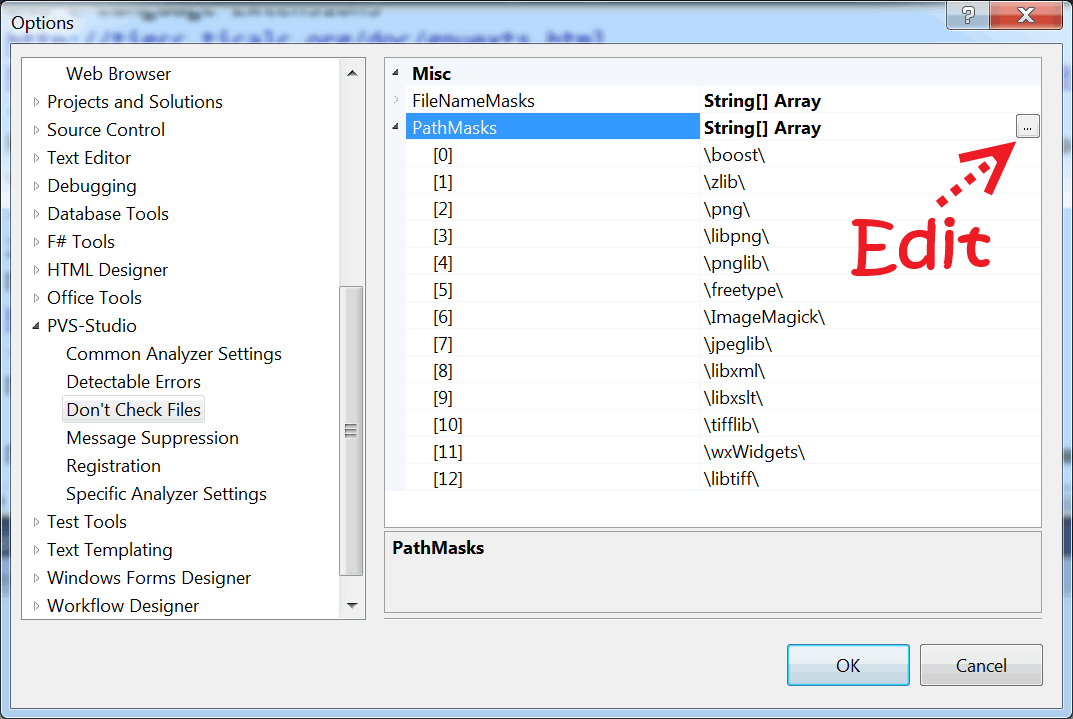
Figure 3. Editing the list of folders you don't want to be checked. Click on the picture to enlarge it.
If the full file path contains one of the specified names, analysis won't run for them. By default the list includes the names of certain folders. However, the folder containing the ZLib library may have a different name in your project - for example "zip_lib" instead of "zlib". That's why you may need to edit this list first. To start editing click on the button with three dots.
These are examples of legal masks for the PathMasks list:
Besides excluding entire folders, you may specify masks for excluding individual files. This is done through the FileNameMasks option. To learn more about how to handle exclusion lists, see the documentation: Settings: Don't Check Files.
Once you're done with the preliminary customization, you can start the analysis of your project. I suggest that you try checking the entire solution at once. To do that, select PVS-Studio->Check->Solution (see Figure 4).
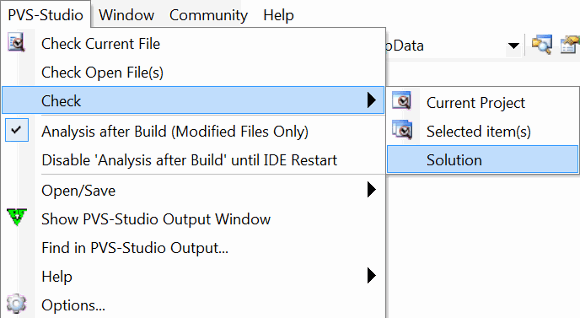
Figure 4. Checking a solution with the PVS-Studio analyzer.
If any troubles occur when trying to run the analysis, see the section "Troubleshooting FAQ" at our website for useful tips. Those are not stupid recommendations of the "make sure the plug is plugged into a wall outlet" kind; no, this section describes typical issues encountered by users and suggests certain algorithms of actions to solve them.
Once the analysis is complete, all the diagnostic messages will be displayed inside a special window. This has a number of control items, all of them designed for filtering the messages in various ways to make navigation among them more convenient. However, you may find the layout of the window too complicated at first, so let's examine all the control items closer (see Figure 5).
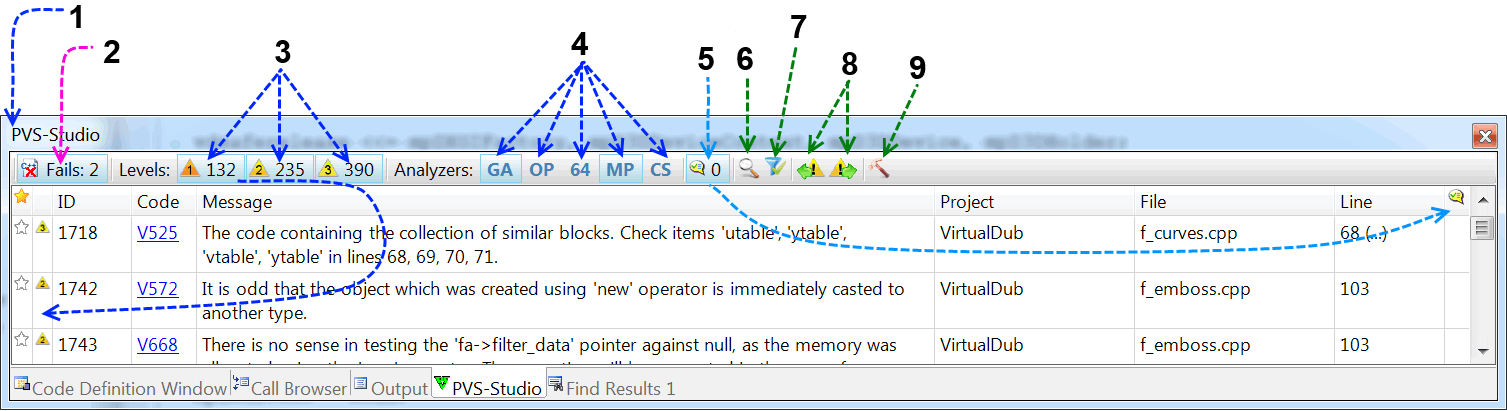
Figure 5. The window with diagnostic messages. Click on the picture to enlarge it.
The table with the diagnostic messages is made up of a number of columns:
It all was tiresome to read, wasn't it? But I assure you that you'll get used to the tool very quickly once you start using it. And you will very rarely have to customize anything.
So, double-clicking on a message gets you to the corresponding code fragment, whereas right-clicking calls the drop-down menu.
The menu is pretty simple and we don't want to overload the article with a detailed description of each menu item. If anything is not clear, refer to the documentation.
However, I'd like to speak of one very useful feature in particular.
Remember you can choose folders/files to be excluded from analysis (Figure 2)? Well, this operation can be done in a much easier way than it seems!
Note the item "Don't check files and hide all messages from...". When clicking on it, you'll see a drop-down list of paths you can add into the exclusion list (see Figure 6).
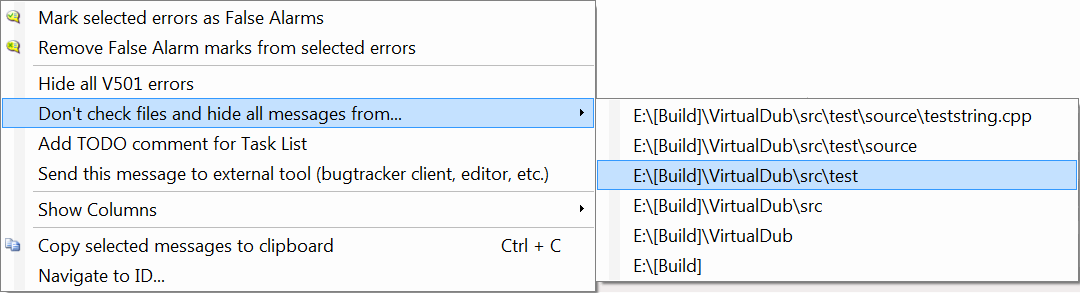
Figure 6. Excluding files from analysis. Click on the picture to enlarge it.
You can choose both an individual file and an entire folder. On the screenshot, we're selecting the folder "E:\[Build]\VirualDub\src\test". It means that all the files in this folder and its subfolders will be excluded from analysis. Besides, all the messages related to these files will be hidden in the message list at once. Convenient, isn't it? You don't have to relaunch analysis to hide all the warnings generated for tests (the "test" folder), for example.
This manual about getting started with PVS-Studio would be incomplete without the description of a very important and useful feature of the tool - incremental code analysis.
We know that the earlier a bug is found, the cheaper it is to fix it. Ideally, bugs should be underlined right as the code is being written. But this is hard and resource-intensive to implement from the technical viewpoint. Instead, PVS-Studio starts in the background right after the modified code has been compiled. Thus, the tool is searching for bugs in the code that has been modified right now. The analysis running status is indicated by a tray icon.
Whenever a bug is found, a pop-out message appears to warn you (see Figure 7) about a possible error.
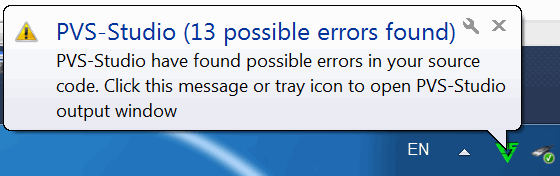
Figure 7. A pop-out message informing you that potential bugs have been found in the recently modified files.
If you click on this message, the PVS-Studio window will open (see Figure 2) where you can examine the suspicious code fragments.
You'd really better try this mode yourself - you'll understand it much easier that way than from my explanation. In short, it works in this way: you go on writing the code as usual, and the analyzer will bother you if necessary. Do try it!
We always use this mode ourselves. Yes, we sometime make mistakes when writing code too, and being able to fix them right away makes it much easier and quicker to find the defect and figure out why the program behaves in a non-expected way. It's a pity when you waste 15-20 minutes on debugging just to find a typo in some index. Here's one of the latest examples when PVS-Studio found a bug inside itself right after it had been added into the code:
if (in[0] == '\\' && in[1] == '.' && in[1] == '\\')
{
  in += 2;
  continue;
}
But that's just trifles, of course. PVS-Studio sometimes proves much more useful. For example, here's a comment by one of our users describing his experience of using the analyzer: "A User's Experience of Working with the Analyzer". The text sets you thinking, doesn't it?
To sum it up: incremental analysis is surely a must-try. You'll get to like it once you've found a few bugs in your freshly written code.
Now, let's be brief. It's impossible to describe in short all the diagnostics provided by PVS-Studio, so refer to the documentation for the complete list of diagnostic rules and their detailed descriptions: Error description. Here I will only paste a table showing the diagnostics grouped into categories. Some of the diagnostics are included into more than one group - because this division is actually quite relative. For example, a typo may cause using an uninitialized memory area. Some of the bugs, on the contrary, are not included into any category, for they are too peculiar. Nevertheless, the table is a good way for you to grasp the general idea about our static code analyzer's capabilities (see Figure 8).

Figure 8. PVS-Studio's capabilities. Click on the picture to enlarge it.
As you can see, the analyzer is especially good at catching bugs caused by typos and using Copy-Paste. It is also good at detecting issues related to code security.
For real-life examples demonstrating these diagnostics in action, see our bug database. We use it to collect all the bugs caught while checking various open-source projects.
We haven't told you everything about our tool, of course, because the article would then turn into a complete documentation. The purpose of this paper was to show you how to easily and comfortably work with the tool within the Visual Studio environment. To learn about support of other environments and modes, see the documentation and other articles found at our website. In addition, you will also find many interesting materials for programmers there. So, welcome to our site - you'll surely spend a while there.
I wish you bugless code and hope you'll like PVS-Studio. If you have any questions, we are always glad to help you. Contact us.
0
0
0
0