
Our website uses cookies to enhance your browsing experience.

The purpose of this article is to give a general overview of the features of the PVS-Studio static analyzer. The simplest and most informative way to do this is to show the tool in action. We'll be sharing examples demonstrating the analysis process using the Visual Studio plugin, the algorithm of running the analyzer under Linux, and analysis log import into SonarQube.

PVS-Studio is a static code analyzer for code written in C, C++, C#, and Java. PVS-Studio provides a wide range of code checks but is especially good at finding typos and copy-paste mistakes (examples: first, second, third, fourth). Static analysis is the perfect complement to code review, one of the oldest and most effective bug-detecting practices. There are issues that peer code review can't help much in finding (typos are among them). For example:
int trans_rest(transcoder_settings *trans)
{
  ....
  for(i=0; i<16; i++);
  {
    trans->eq.eq.preamp[i]   = 0.0;
    for(j=0; j<32; j++)
    {
      trans->eq.eq.boost[i][j] = 0.0;
    }
  }
}
If you haven't noticed the typo, look at the semicolon after the first for. Another example:
private class ObjectArrayComparer : IEqualityComparer<object[]>
{
  public bool Equals(object[] x, object[] y)
  {
    ....
    for (int i = 0; i < x.Length; i++)
    {
      if (!object.Equals(x[0], y[0]))
      {
        return false;
      }
    }
    return true;
  }
  ....
}
This code will be comparing the same pair of elements all the time. It is to keep you from wasting time hunting errors like this that static analysis should be adopted. You can download PVS-Studio here and try it out on your own projects.
Among other formats, PVS-Studio comes as a plugin for Visual Studio 2010-2019. Before running the check, let's see what this plugin can do. Below I'm giving a brief overview of some of the menu commands that you may find confusing.
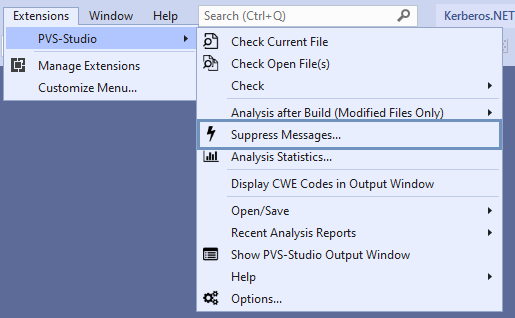
Note the "Suppress Messages" command. It opens the window for managing suppressed warnings of the analyzer. This needs explanation. PVS-Studio allows you to suppress warnings, which makes it easier to start using the tool even in a particularly large project. Thanks to this option, you can quickly and easily integrate the analyzer into your development process.
Integration is painless with fairly small projects. But if your project has a long history, you may be already hesitating and doubting because filtering lots of diagnostic messages would require finding a person to do that task, allocating a certain amount of time for that, and so on. I'll try to dispel these doubts.
The ideal strategy in this case is as follows. You run the analyzer on your project and get a huge pile of warnings. You tell PVS-Studio to hide them using the warning-suppression mechanism. Since your project has been in development for a long time, you aren't likely to get many warnings about critical defects. Your team keeps working on the project and gets warnings only on freshly written or modified code. The warnings that you have suppressed in the beginning are now your technical debt, which you could be getting back to every now and then, gradually eliminating it. Learn more about the suppression mechanism.
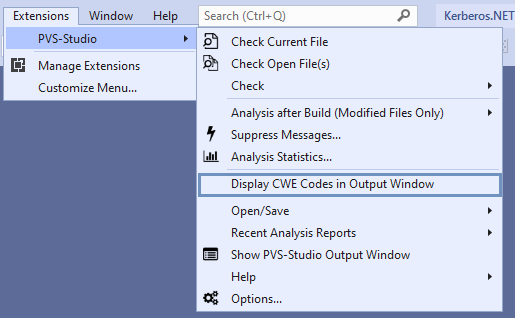
The next command I'd like to talk about is called "Display CWE Codes in Output Window". PVS-Studio is a static application security testing (SAST) tool, which means its warnings can be classified according to the Common Weakness Enumeration (CWE). See the following resources for more details on the use of the CWE classification in PVS-Studio, the idea behind the CWE itself, and so on:
Now let's click the "Options" command.
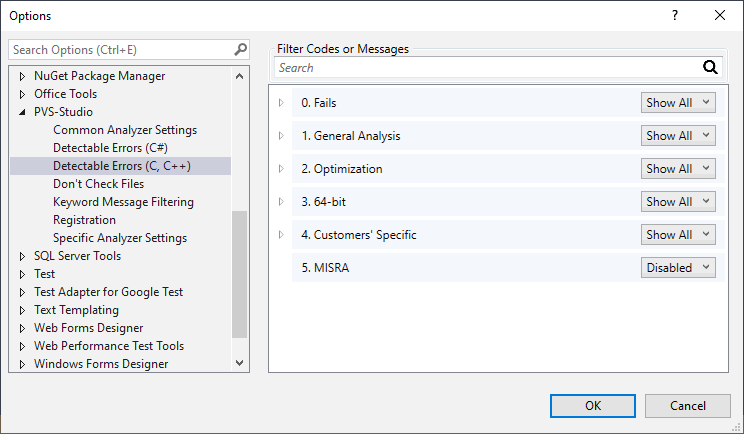
In the "Detectable Errors (C, C++)" subsection, you can specify which collections of diagnostics will be applied during the analysis. Here you can hide or turn off diagnostic messages that are for some reason irrelevant to your project. For instance, you aren't likely to be interested in the MISRA diagnostics unless you are an embedded software developer. That's why they are turned off by default. A user running PVS-Studio for the first time may be confused and frustrated by the huge number of MISRA warnings. But those who want to check their project specifically for compliance with MISRA requirements can turn on those diagnostics at any time.
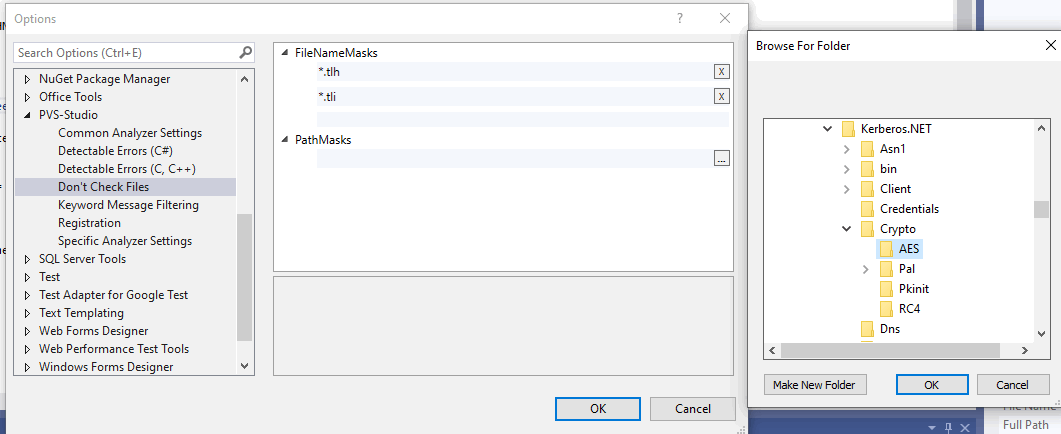
In this window, you can specify paths/masks to selectively exclude files and folders from analysis. You can choose between path masks and filename masks. This option is used to exclude from analysis third-party libraries, automatically generated files, and so on. Once you've specified the exclusion masks, the messages associated with those files and folders will disappear from the PVS-Studio output window and stay inactive during the next checks. Thus, excluding files and folders from analysis using masks can help significantly reduce the overall analysis time.
More details here.
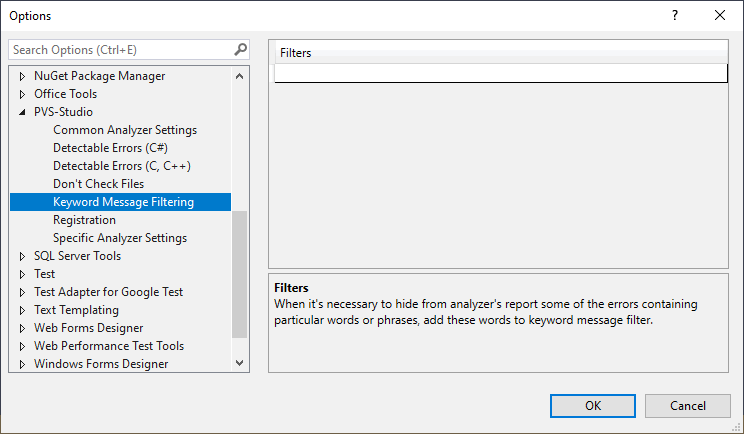
Similarly, you can filter the analyzer's output by text. Suppose some of the messages in your report refer to the my_super_function function, while you know for sure that all of them are false positives. Just add the word my_super_function to the filter field to filter off all the warnings containing it. Just in case, here's a link to the documentation section covering this topic.
Note. PVS-Studio provides other ways of marking false positives in code or macros as well. They are all covered in the "Suppression of false alarms" section of the documentation.
Now that we're finished with the settings overview, let's check a project. You may have noticed that I mentioned a few C++-related options but said nothing about options specific to C# and Java. It's just that C++-related options are greater in number, so we decided to specifically focus on them in this brief overview. To keep it interesting, though, I'm going to analyze a C# project instead of a C++ one using our Visual Studio plugin and show you what the analysis report looks like.
Obviously, you'll have to go back to the settings after the first check to reduce the number of false positives. They are inevitable, but you can cut their rate to a desired minimum by tweaking the settings. For more details, see the article "Characteristics of PVS-Studio analyzer by the example of EFL Core Libraries, 10-15% of false positives".
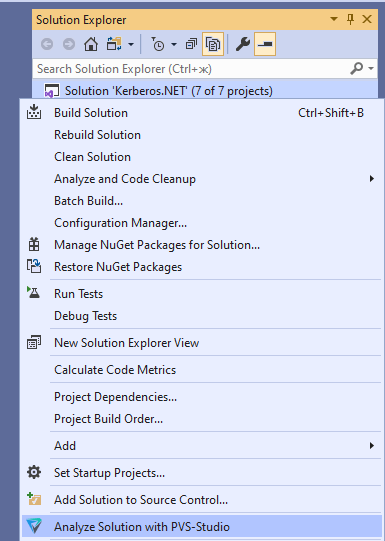
Click "Analyze Solution with PVS-Studio".
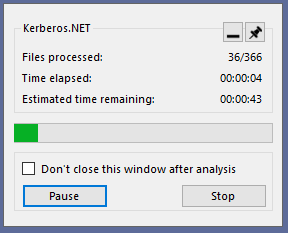
A window with a progress bar will appear.
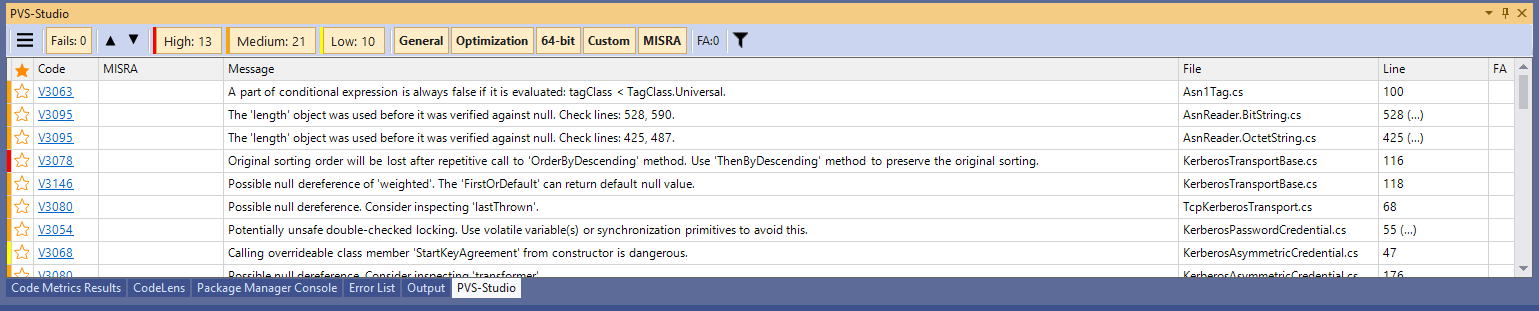
Once the check is over, you can study the report.
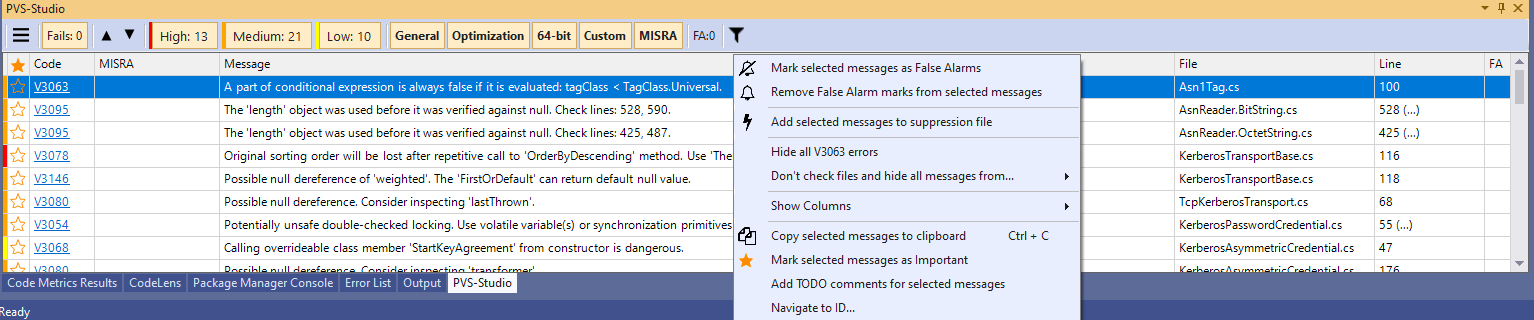
By the way, you can filter warnings in this window as well. For example, you can hide the first warning on the list by selecting it and clicking "Mark selected messages as False Alarms". Again, all the details are available in the documentation section "Suppression of false alarms".
We have checked a C# project. Now let's check a C++ program but do that in Linux instead. By the way, PVS-Studio can check projects in any of the supported languages (C, C++, C#, Java) on Windows, Linux, and macOS.
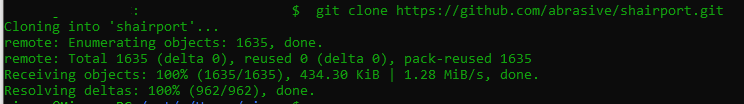
First we clone the repository.
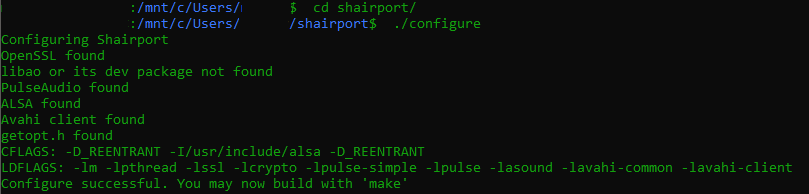
Then we run the build configuration script.
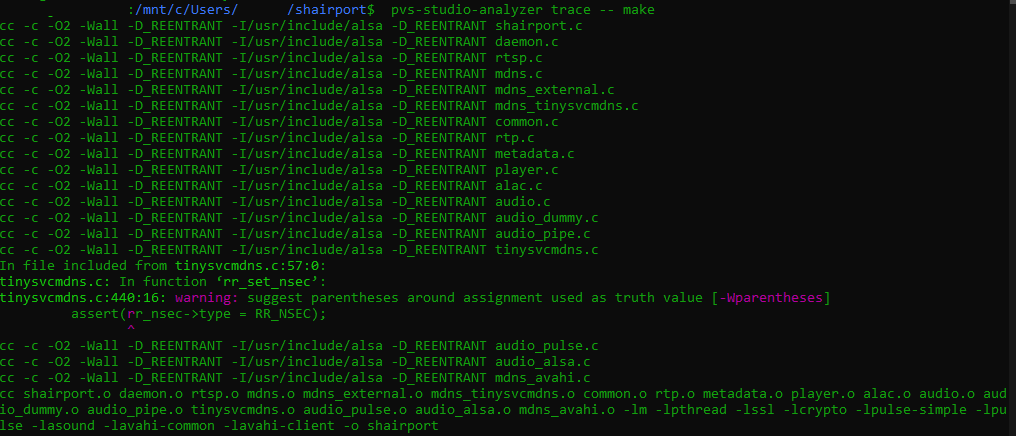
Next, we run PVS-Studio in tracing mode and build the project. To do that, you need the strace utility installed on your computer. In your own project, you can use any other build command with any necessary options in place of make.
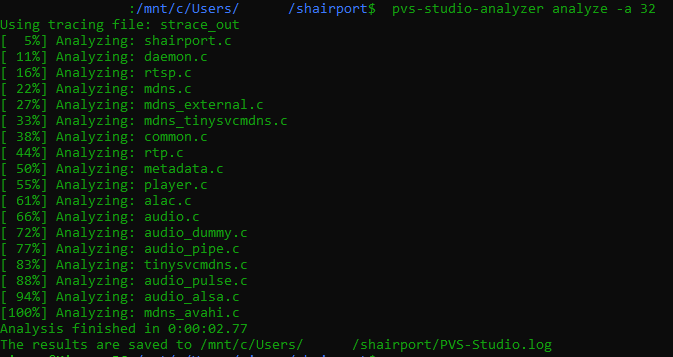
Now we analyze the project files using the results obtained at the previous step. The -a option is used to specify which warnings you want to be included in the report.
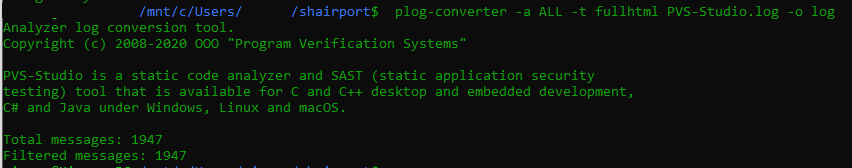
Convert the log into an html file and enjoy the nicely-formatted report.
That was a description of just one of the possible ways of checking a project in Linux, and quite a formal one, without going much into detail. One of the other approaches is to add an analyzer call command to the makefile. To learn more about checking projects in Linux, see the following resources:
SonarQube is an open-source platform for continuous analysis and measurement of code quality that supports many programming languages and provides reports on such metrics as code duplicates, coding style compliance, test coverage, code complexity, potential bugs, and so on.
PVS-Studio includes a plugin for importing analysis results into SonarQube, so let's try this option.
First we need to get the analysis report and the configuration file sonar-project.properties.
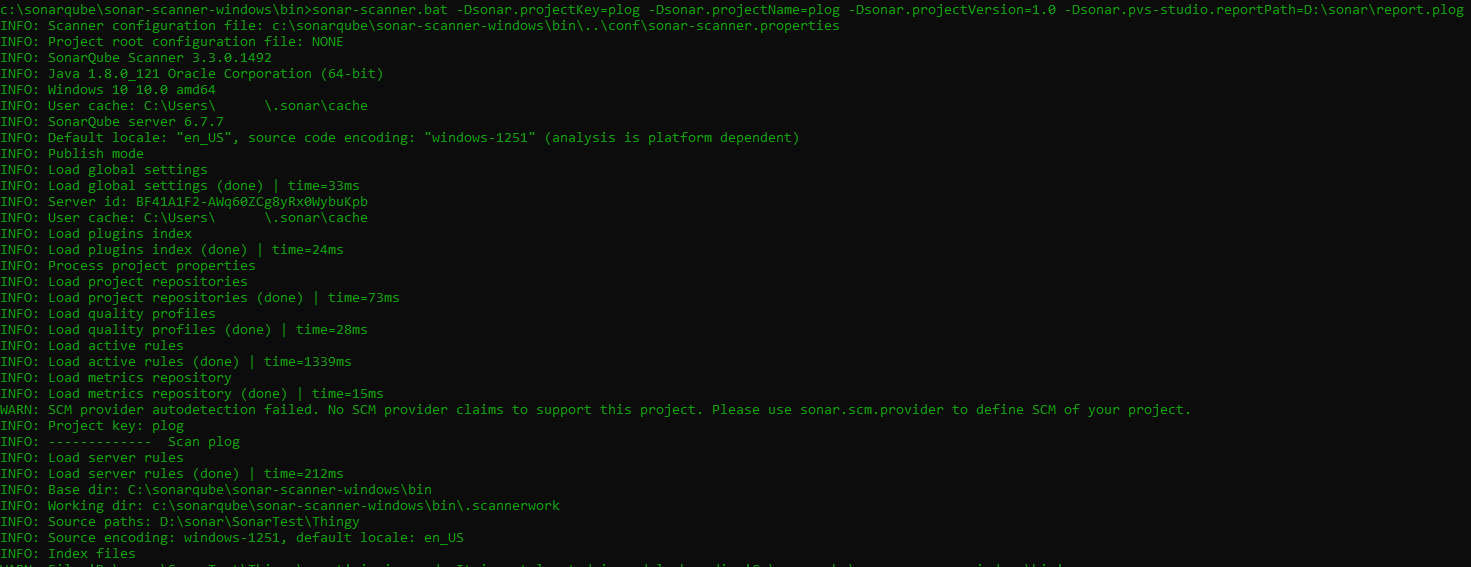
Then we need a command to run the scanner.
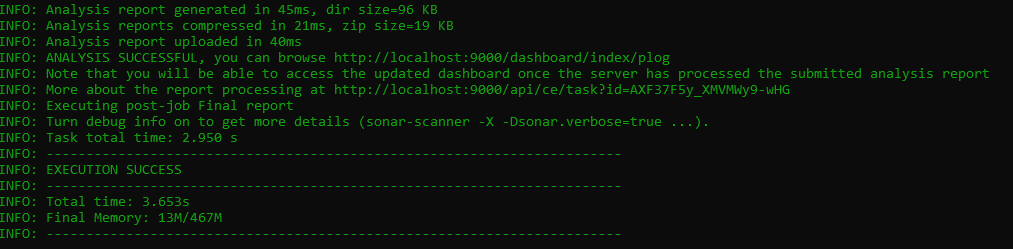
And here's the result :)
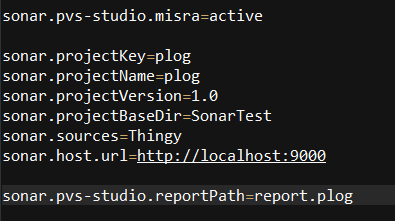
You can also create (or modify) a configuration file. For instance, in the screenshot above, we have activated the option of adding MISRA identification tags to the warnings. That's right, MISRA diagnostics are disabled in this plugin too. If you need to check your code for MISRA compliance, just add "active" to your configuration file to turn this option on.
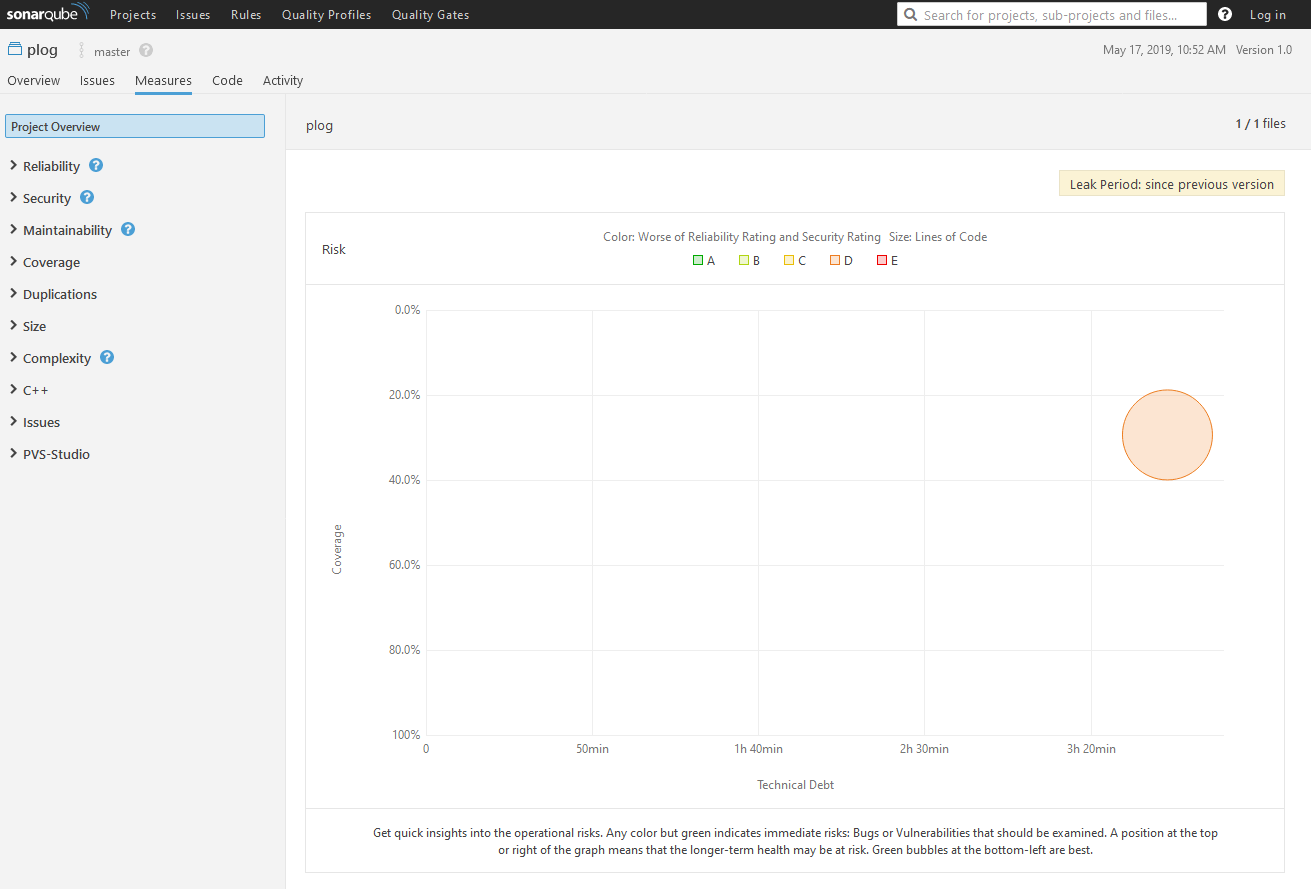
The Measures tab contains a variety of code metrics and graphs.
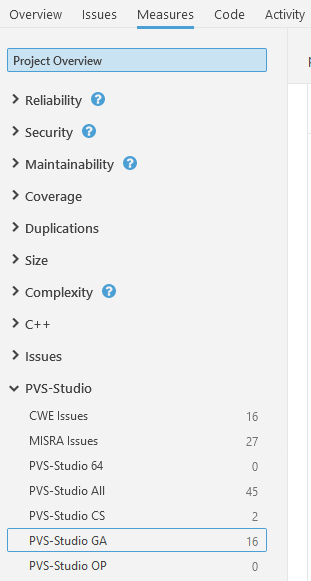
You can also use the PVS-Studio section to plot graphs. For more information about integrating PVS-Studio analysis results into SonarQube, see this documentation section.
We have looked at the settings for C++ projects and analyzed a C# project but ignored Java so far. Let's get this fixed and talk about the PVS-Studio Java analyzer. There are many ways to integrate it with your project. Depending on your build system, you can use the Maven plugin or Gradle plugin. You can also use the analyzer core executable directly. Either way allows you to easily work with SonarQube or CI (Jenkins). If you have these plugins enabled, Java projects will be checked during the build process, so you will get a PVS-Studio log along with the built application.
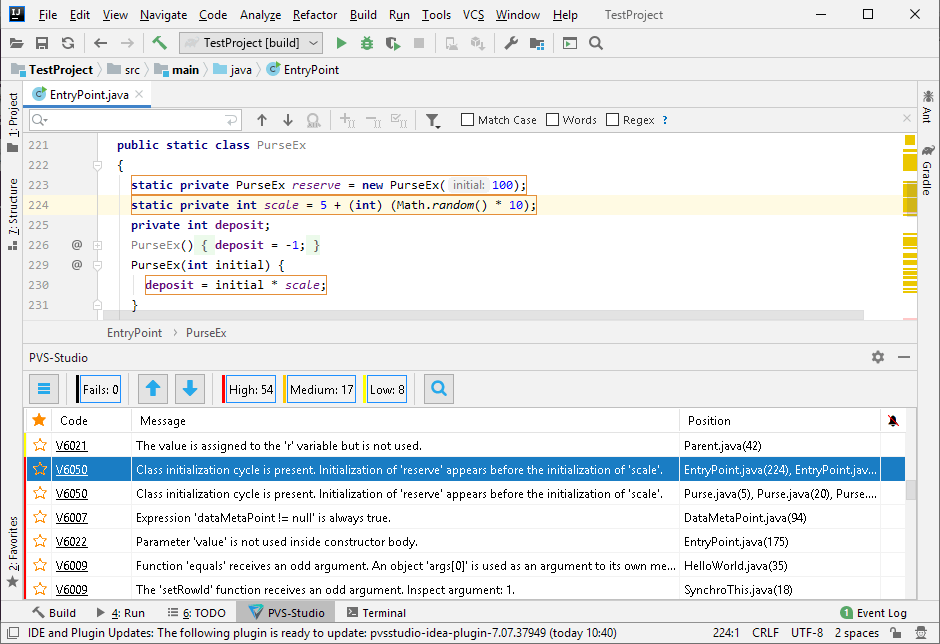
The PVS-Studio Java analyzer can also be used as a plugin for IntelliJ IDEA. In this case, the parsing is done by the IDE itself, while the plugin provides a nice GUI for managing the analyzer.
This topic is covered in detail in the "How to run PVS-Studio Java" section.
The Java analyzer also supports warning suppression for fast and painless integration with large projects.
This is how it is done in IntelliJ IDEA.
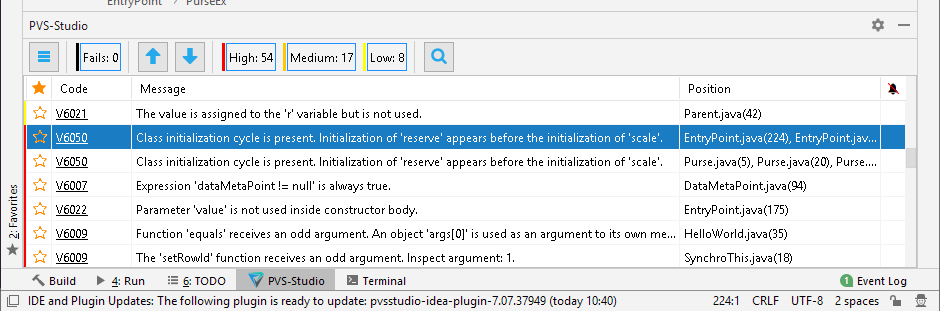
This window displays the analysis report.
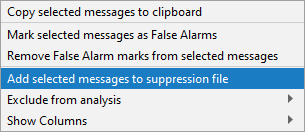
Right-clicking a selected message opens the context menu. There, we can select the command, as shown in the picture, to hide the message from the output window.
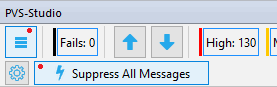
You can also suppress all the warnings at once.
In Gradle, this is done by running the following command:
./gradlew pvsSuppress "-Ppvsstudio.report=/path/to/report.json"
  "-Ppvsstudio.output=/path/to/suppress_base.json"
In Maven, this is done by running the following command:
mvn pvsstudio:pvsSuppress "-Dpvsstudio.report=/path/to/report.json"
  "-Dpvsstudio.output=/path/to/suppress_base.json"
More about warning suppression here.
The purpose of this article was to give an overview of PVS-Studio's features and to show how easily it can be used through the Visual Studio plugin and in Linux. Integration with SonarQube provides continuous code quality analysis and management, which is just one of the many abilities described in the documentation.
With the analyzer integrated into your CI system, you can catch bugs immediately after building the project, which makes bug search and fixing much cheaper. The articles below show some examples of integrating PVS-Studio with the most popular cloud services:
0
0
0

0