
Our website uses cookies to enhance your browsing experience.

Now you can take advantage of static analysis when working with the Visual Studio Code editor due to the new PVS-Studio extension. In this article, we will explore the use of the plugin, from installation to handling the analysis results. Let's get started!

PVS-Studio is a static code analyzer for C, C++, C#, and Java projects. In December 2022, the PVS-Studio team released extensions for Visual Studio Code and Qt Creator. At the moment, both plugins can be used to work with the analysis results. It is not yet possible to run the analysis directly from the extensions, but we're going to add this feature in upcoming releases. Currently, you can run the analysis in plugins for Rider and Visual Studio, or run the analyzer from the command line.
But let's go back to the chief topic of this article. I would like to introduce you to the new PVS-Studio extension for Visual Studio Code and show how you could use it in your project.
First of all, we need to install PVS-Studio. You can download the installation file of the analyzer from the official website.
You shouldn't have any difficulties when installing the analyzer. However, you can always consult the PVS-Studio installation guide for Windows.
Note. In the 'Select Components' installation step, you can select 'Integration with Visual Studio Code'. As a result, the VS Code plugin is installed along with the analyzer.
You can find out how to install the PVS-Studio analyzer on Linux and macOS in the following documentation sections:
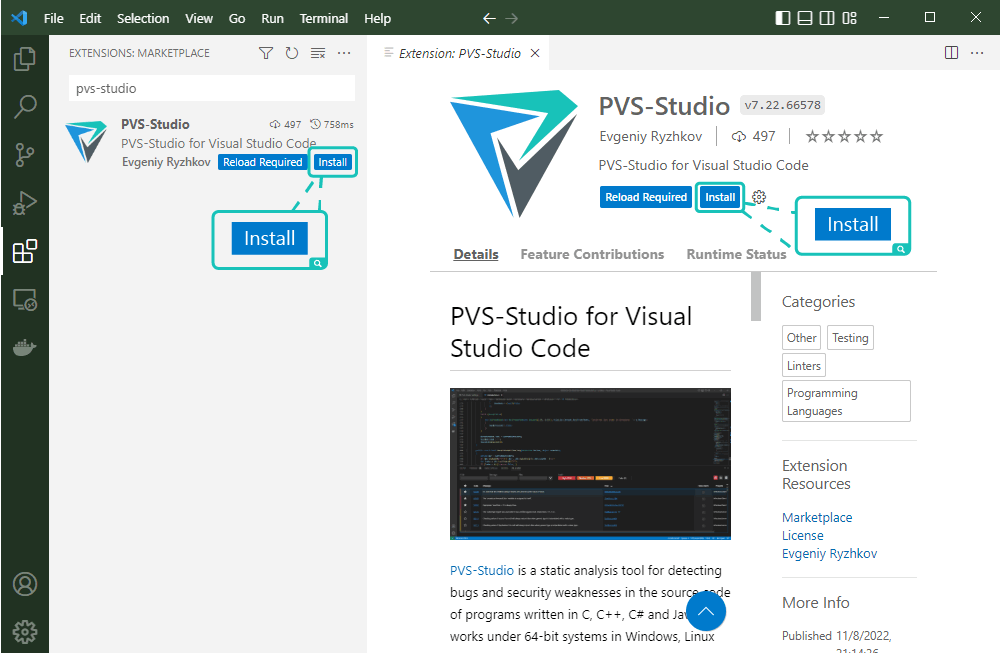
If the extension has not been installed along with the analyzer, you can install it separately. To install the PVS-Studio extension, open Visual Studio Code and click the 'Extensions' tab, then type 'PVS-Studio' into the search box and click the 'Install' button:
Let's try the new plugin and the analyzer on a real project. In this article, we used the open-source project to show how the analyzer works.
Running the analysis directly from VS Code is not supported yet, this feature will be added in future releases. For now, you can use the command line instead.
I used the following command to analyze a C#-application on a Linux operating system:
pvs-studio-dotnet -t Solution.sln -o PVS-Studio_Result.json -rThe following parameters are used in this command:
Note. Running the analysis from the command line may vary depending on the operating system and the programming language of the project being analyzed. You can consult the PVS-Studio documentation for guidelines on how to run an analysis specifically for your case.
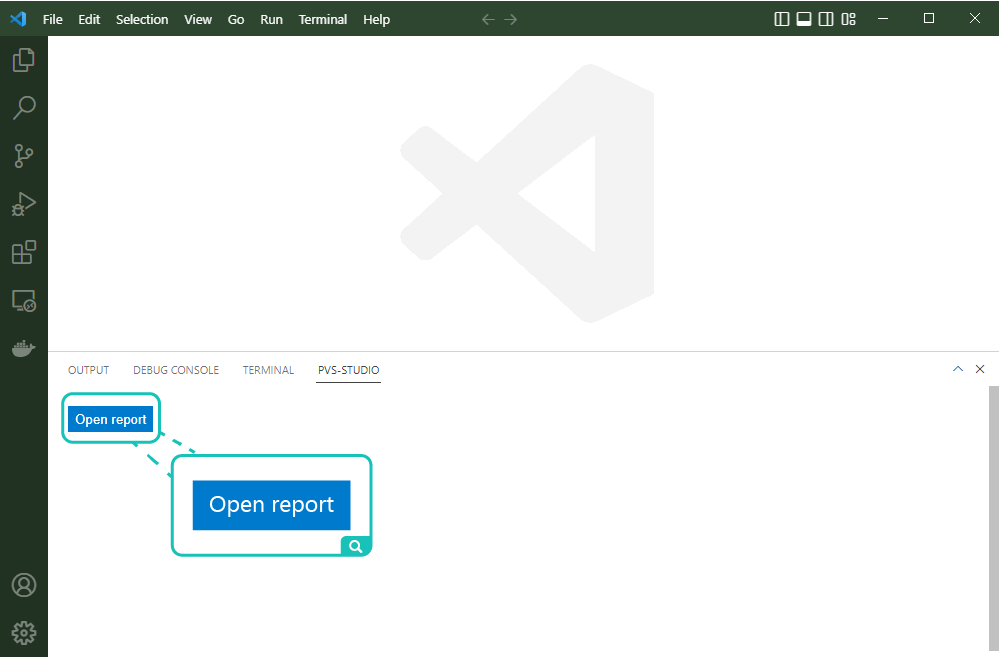
Let's switch back to VS Code and go to the 'PVS-Studio' tab. Click the 'Open report' button here:
Select the report file in the dialog box. Please note that the VS Code extension now only supports reports in the json format. If you are running PVS-Studio on Windows, the report may have been generated in the 'plog' format. In this case you may need to convert the report into the json format beforehand. You can do it with the help of the 'PlogConverter' utility that is included into the PVS-Studio distribution kit. For more information about the utility, see the documentation section on how to view and convert analyzer's results.
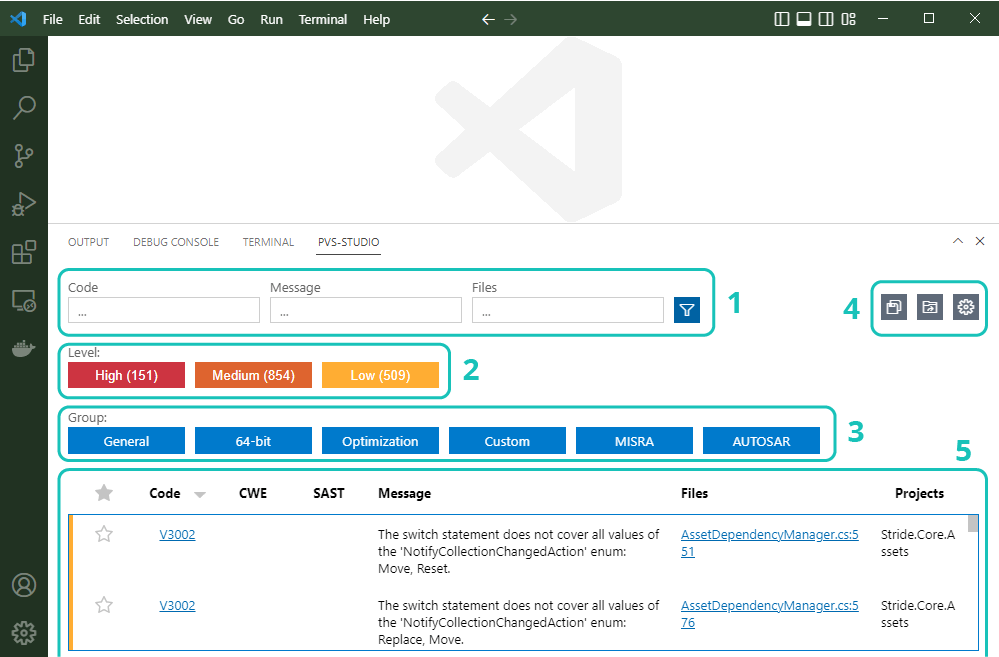
The interface of the plugin can be divided into five areas:
We will discuss some of the plugin's features below. In case you would like to find out more information about the VS Code extension, you can consult its documentation section.
Take a look at the interface area number 2:
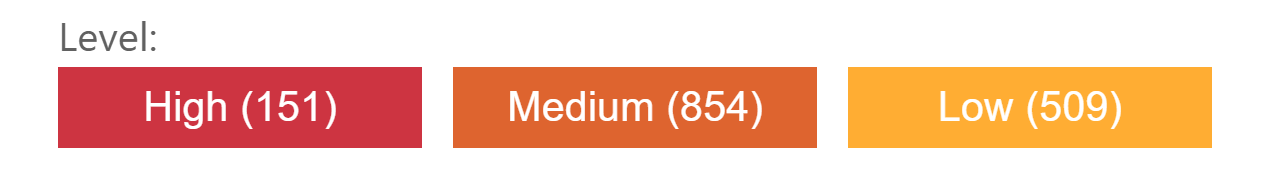
In this area you can enable/disable warnings of a certain level. The analyzer divides all warnings into 3 levels, which denote how likely a warning indicates an actual error.
As you can see on the screenshot, each level also displays the number of warnings issued.
Now why don't we find some bug in the project using the analyzer report?
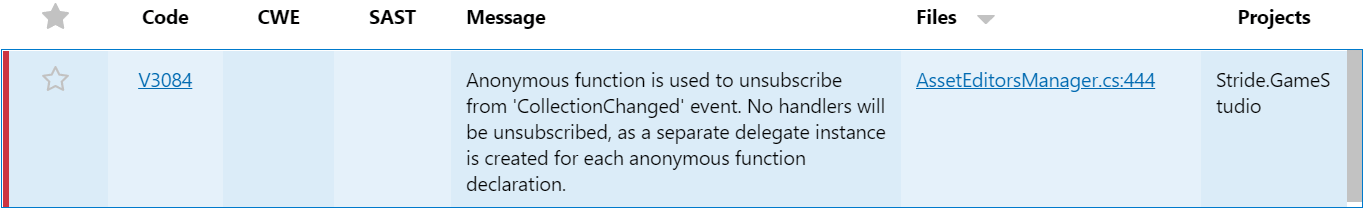
The analyzer reports that an anonymous function is used to unsubscribe from the event. Double-click on the warning line to see the code fragment:
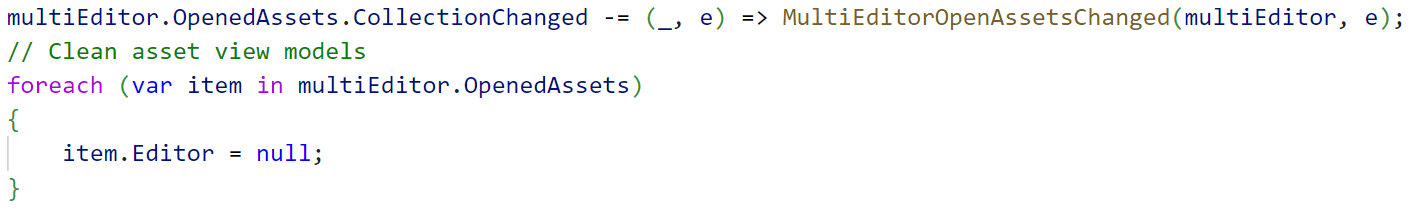
Indeed, an anonymous function is declared here and used to unsubscribe from the CollectionChanged event. The developer did not pay attention to the fact that all anonymous functions are unique objects. That's why this anonymous function has nothing to do with any of the handlers, which means no handlers will be unsubscribed.
Now the VS Code extension provides the basic functionality for handling PVS-Studio reports. Soon you will be able to run the analysis directly from the plugin, which will make it even more handy. We're going to implement this feature step-by-step: first, the analysis of C and C++ projects will be supported, and then the analysis of C# projects.
In this article, we have examined how the code analyzer works together with the new PVS-Studio plugin for Visual Studio Code.
If you haven't tried the analyzer yet, you can download it here.
I hope you enjoyed reading this article :)
Good luck and clean code to you! Thank you and see you soon!
0
0
0
0