
Our website uses cookies to enhance your browsing experience.

Let us begin with mentioning that this article is completely non-serious. New Year is coming, holidays are almost there and there is no reason to do anything deliberate. That is why we decided to write an article about, suddenly, statistics.

This article indirectly connected with one of the discussion we were participating in few weeks ago. It was about the possibility of some consistent patterns in errors in this or that line in duplicated code. We often refer to the article "The Last Line Effect" - according to our observations, lines of code of the same type and structure generated by copy and paste technique is more likely to be erroneous in the last line. The discussion was about the fact of error possibility in other places in duplicating blocks. Unfortunately, it is difficult to gather statistics about places when the error occurs in these examples. However, it gave us an idea to make small statistic study on our examples base.
We should mention that we wrote this article in jocose style, because we had not found any real consistent patterns. Many people can remember that "There are three kinds of lies: lies, damned lies, and statistics" and distrust any statistic researches. This may be a valid point, because statistics oriented to mass media is usually used to find relations in cases when there are no connection at all. One of the most widely known example is "Mars effect". However, that is not our case. We claim from the beginning that this statistical study does not pretend to be serious. Any statistical dependencies in this article either obvious, "does not prove any causation" or does not surpass statistical significance due to small sample size.
Well, let us begin. While Google tries to gather statistics about what people hate, we are trying to gather statistics about what analyzer hate.

Really? You have got to be kidding, have not you?
Anyone who is familiar with any programming language can tell for sure that some words and symbols occur in source code more frequently than others do. Even in Brainfuck code symbol '+' is more frequent than symbol '.'. The only arguable "programming language" used to write real programs is even not an Assembler but a machine code itself. Experts can also remember other counterexamples from esoteric languages like Malbolge etc. However, what about C++? It is expected that "int" keyword should be more frequent than "float", "public" should be more frequent than "protected" and "class" should be more frequent than "struct" and, all the more so, "union". Still, which words are the most frequent ones in pieces of C++ code containing errors? We counted word frequency by evaluating the number of words in all the examples, i.e. if one example contained two occurrences of "if" keyword, then program counted it twice. Words is comments was omitted. List of the most frequent words is presented below (number before colon is a number of occurrences in all the examples):
"Conclusion": "if" causes many errors.
Next words gives us a light of hope; not the words by itself, but their frequency compared to "if" and even "case":
It looks like not everything is that bad with structure of Open Source applications.
However, words like "auto" are not frequent at all (less than five occurrences) as well as "constexpr", as "unique_ptr" etc. On the one hand, it was to be expected, because we started collecting examples long ago, when nobody even thought about implementing C++11 standard. On the other hand, there is another subtext: language extensions are introduced to decrease the probability of making a mistake. Let us recall that our base contains only code with errors that was found by PVS-Studio static code analyzer.
We gathered similar statistics on numbers.
It is curious that number 4 in examples of erroneous code is more frequent then 3; moreover, this fact is not related to 64-bit diagnostics - even if there are present some errors from 64-bit diagnostics, they are small in quantity (not more than one or two code example). Majority of examples (at least 99%) are general analysis errors.
It is likely that four is more frequent than three are, however insignificantly, because four is a "round number" while three is not (do you understand me?). This is why 8, 16, 64, 256 are in breakaway too. This is the reasons behind oddity of distribution.

Next is a short test for wits and knowledge. Do you think where those numbers came from, 4996 and 2047?
The answer is in the end of the next paragraph.
According to this statistics, the most frequent letter in formal English is 'e'. Ten most frequent letters in English are e, t, a, o, i, n, s, h, r, d. We asked ourselves about the frequency of letters in C++ source code fragments. Then we made another experiment. Approach was even more brutal and heartless than previous one. We simply counted every symbol in every example. Case did not matter, i.e. 'K' = 'k'. The results are presented below:
The most frequent symbol is a space. In formal English space symbol is slightly more frequent than 'e' letter, but that is not our case. Space is used widely for indentation, which provides solid first place in terms of frequency at least in our examples, because we had replaced all the tabs to spaces to ease formatting. In addition, what about the rest? Letters 'i' (leader on a counters name market since 19XX), 'r' (our assumption - used in names like run, rand, vector, read, write, and, most of all, error) and 's' (std::string s) are much more frequent. However, due to the large sample size we can claim that letters 'e' and 't' is also the most frequent letters in C++ source code as well as in formal English.
Some words about the dot. Of course, in real examples dot is not as frequent as it is in the list above. The thing is our database omits a lot of excess code that is not required to understand errors, and four dots are used for omitted code. That is why dot is probably not one of the most frequent symbols of C++ language.
Does anybody mentioned entropy encoding?
Okay, let us check it from another point of view. Which symbol is the least frequent one?
In addition, another strange result that amazed us. Look at the quantity of these symbols. It is almost coincide (somewhere it coincides exactly!). That is weird. How could this happen?
Ah, well, the promised answer to the question from previous paragraph. 2047 = 2048 - 1, and number 4996 came from lines like
#pragma warning (disable:4996)It reminds correlation analysis in some way. The problem was set like that: is there any dependency between occurrences of some pair of words?
What is the reason behind words "in some way" in previous sentence? We decided to evaluate relative value that resembles correlation coefficient, but it is not actually correlation coefficient, because it can change only between 0 and 1 inclusively and is measured for every pair of words (a,b) this way. For instance, word a was occurred in Na examples, word b - in Nb examples, both a and b in Nab examples. Given that, Rab = Nab / Na, Rba = Nab / Nb. Using the fact that 0 <= Nab <= Na, Nb; Na, Nb > 0 it is possible to prove that, obviously, 0 <= Rab, Rba <= 1.
How does it work? Let us make an assumption that word 'void' was encountered in 500 examples, word 'int' in 2000 examples, and both 'void' and 'int' were encountered in 100 examples. Then Rvoid,int = 100 / 500 = 20%, Rint,void = 100 / 2000 = 5%. Yes, this coefficient is asymmetrical (Rab in general is not equal to Rba); however, it is hardly an obstacle.
Perhaps, it is possible to talk about an even slightest statistical dependency when R >= 50%. Why 50%? Just because we wanted to. Actually, thresholds are usually chosen approximately and there are no clear recommendations. 95% value should, perhaps, indicate strong dependency. Perhabs.

Well, using correlation analysis, we were able to find out these stunning, unorthodox facts:
Et cetera. Here are some "obvious" blocks below.
At least it proves that program works, and by 'work' we mean meaningless operations to find all the dependencies between 'main', 'argc' and 'argv'.
Compiler directives insanity. Analysis has found all the dependencies between words 'disable', 'pragma', 'warning' and 'default'. It seems like all these examples came from V665 database - take a note that there are eleven examples. By the way, these dependencies may be unclear for a non-programmer, but should be obvious for programmer.
Let us continue.
This probably may be left without commenting at all. Strong dependencies between WPARAM and LPARAM types and their default names lParam and wParam. By the way, this words are coming from 16-bit versions of Windows, moreover, it seems like their origin is Windows 3.11. That is a demonstrative proof that Microsoft makes a lot of work in terms of compatibility from year to year.
However, there were interesting results too.
First two elements of this list imply that, probably, there are no example with unconditional continue or goto. Third one does not imply anything, because break can be used not only in cycle, but also in switch operator, which by itself replaces bunches of 'if' operators. Or does it? Is 'if' operator indicates that 'goto' or 'continue' are conditional? Does anybody mentioned V612 diagnostics? In my defense, however, I can tell that there are no single 'goto' and 'continue' in in V612 examples at all! Nevertheless, situation with 'break' is not that pleasant.
The authors of the real code try to avoid "using namespace std;" construction in headers, which is certainly good for code reviewers, let it is sometimes not convenient for programmers (of course, we are talking about five symbols!).
Most frequently, memory is filled with zeroes, at least in our examples. Yes, of course, diagnostics V597 had a huge impact on that, as well as V575, V512 etc.
By the way, memory is filled by zeroes more frequently than sizeof is used, which is strange and justified only in case when programmer fills an array of bytes with known size. The other case is an error like V512, when sizeof is missing in third argument of memset.
In majority of cases cycles starts from zero. Well, that is not a phrase to stress differences between C++ and Pascal or, for instance, Mathematica. Of course, many cycles count from zero. This is may be the reason why foreach operator was introduced in C++11, that can also deal not only with the classes with redefined begin(), end() etc, but with a usial arrays too (but not with pointers to arrays). Additionally, it is much harder to make an error in foreach cycle than in for cycle.
So it goes. In addition, this analysis had been taking one hour and seven minutes in release mode on eight-core processor.
Strictly speaking, title of this paragraph should speak of its own. There was a suspicion that programmers tend to make errors with some caption. This suspicion was shattered into pieces when it met with reality - functions are called very differently, and the same function in different projects may be called ReadData(), readData(), read_data(), ReAdDaTa() etc. So the first idea was to write additional subprogram that would split function names into words, such as 'read' and 'data' in first three cases, and would try to burn the fourth case with fire.
After splitting all the function names with errors, we got this distribution.
It seems like mistakes are more likely in 'get' functions than in 'set' functions. Alternatively, maybe, our analyzer finds more errors in 'get' functions than in 'set' functions. Maybe, 'get' functions are more frequent then 'set' functions.
Analysis fully similar to the previous one was conducted on a set of function words. This time results is not that big and can be shown fully. There are no clear correlations in function names. However, we were able to find something.
Significance of this magnificent result is comparable with this correlation:

Again, this assumption is in obvious style. No one from analyzer development team set an objective to make every diagnostic pop up with nearly the same frequency. In addition, even if this task would been set, some errors would have shown themselves almost on the spot (like V614). They are usually made to speed up the development with advice 'on the fly'. Some errors, however, can remain unnoticed until the end of product lifecycle (like V597). Our database contains errors found after Open Source application analysis (at least the most part of it); moreover, it is usually stable version. Do I need to mention that we find errors of the second class much more frequently than errors of the first class?
Again, the methodology is simple. Let us illustrate it on an example. Database contains an error like this:
NetXMS
V668 There is no sense in .... calltip.cpp 260
PRectangle CallTip::CallTipStart(....)
{
  ....
  val = new char[strlen(defn) + 1];
  if (!val)
    return PRectangle();
  ....
}
Identical errors can be found in some other places:
    V668 There is no sense in .... cellbuffer.cpp 153
    V668 There is no sense in .... document.cpp 1377
    V668 There is no sense in .... document.cpp 1399
    And 23 additional diagnostic messages.
First record is a short name of project. We shall use it, but not now. Next record contains information about an error - number of a diagnostic rule, its description, and relevant .cpp file name with line number. Next record contains code; we are not interested in it for now. Next database contain records containing additional places with another information string. This information may be absent. Last record hosts number of errors that were skipped to shorten error description. After processing, we should receive an information that V668 diagnostics found 1 + 3 + 23 = 27 errors. We can proceed to the next entry.
Now then, the most frequent diagnostics are:
Two diagnostics related to work with memory are leading. This is not surprising, because C/C++ languages implement "unsafe" memory management. V595 diagnostics searches for cases when it is possible to dereference null pointer, V668 diagnostics warns about the fact that checking a pointer received from new operator against null does not have any sense, because new throws an exception if memory cannot be allocated. Yes, 9X.XX% programmers make errors while working with memory in C/C++.

Next idea was to check which projects are the most prone to errors and to which ones. Well, no sooner said than done.
Last assumption is not very graceful either. The idea is simple. Is there a line or a group of lines (like, for example, from 67 to 75), where programmers tend to make errors more frequently? Obvious fact: programmers rarely mistake in first ten lines (usually it is about #pragma once or #include "file.h"). It is also obvious that programmers rarely mistake in lines from 30000 to 30100. It is because there are usually no files that large in real projects.
Strictly speaking, method was quite simple. Every diagnostic message contain number of line of source file. However, not every error has an information about source line. It is possible to extract only four line numbers from the example above out of 27, because the rest 23 are not detailed at all. Nevertheless, even this tool can extract many errors from database. The only problem is that there is no total size of .cpp file in database, so it is impossible to normalize results to make them relatival. In other words, one does not simply check the hypothesis that 80% of errors occurs in last 20% of file.
This time we present histogram instead of text.
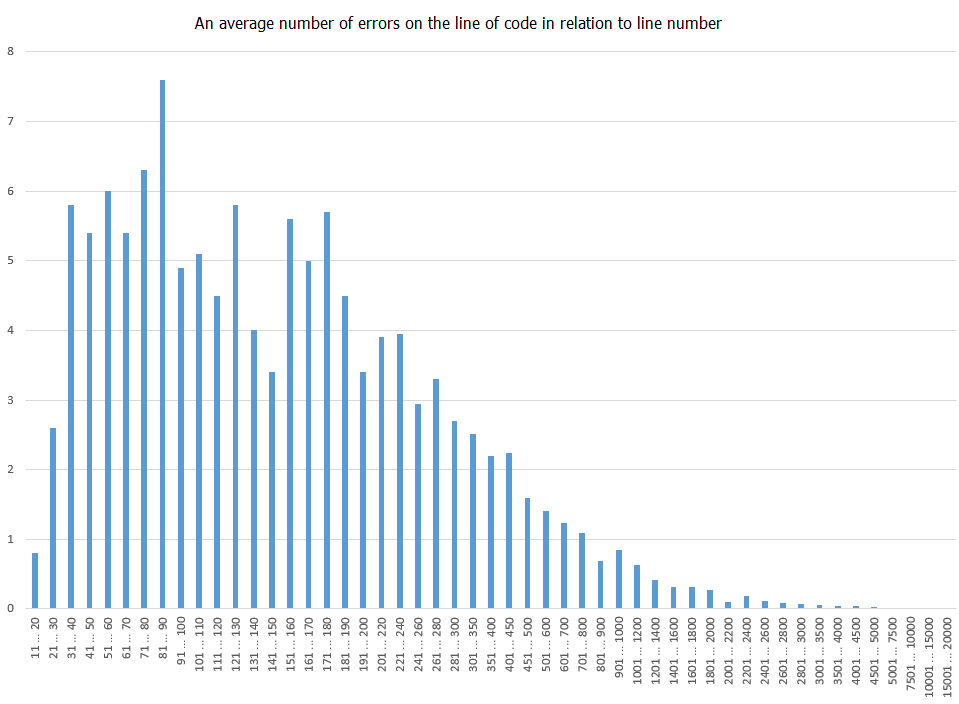
Figure 1 - Error density histogram
Let us clarify how we made our evaluations in application to first column. We counted all the errors made in lines from 11 to 20 and then divided it into the number of lines from 11 to 20 inclusive (i.e. into 10). In summary, on average in all projects there were slightly less than one error in lines from 11 to 20. This result is shown on histogram. Let us remind that we have not done any normalization - it was more important for us not to show precise values that would barely represent dynamics due to small sample size anyway, but to show the approximate form of distribution.
Despite the fact that histogram contains sharp derivations from trending line (and it slightly reminds log-normal distribution), we decided not to prove that the mistakes are made the most frequently from lines 81 to 90. Still, draw a plot is one kind of problem, to proof something based on it - another kind of problem that is much more difficult. We decided to leave only generic phrase. "Unfortunately, it looks like all derivations does not exceed statistical threshold value". That is all.
In this article, we managed to show how it is possible to make money by making nonsense.
Speaking seriously, there are two problems related to data mining on error database. First one - what should we search for? "The Last Line Effect" can be proved manually (and should be, because automatic search of similar blocks is ungrateful), and the rest runs up with an absence of ideas. Second problem - is sample size large enough? It is possible that sample size for letter frequency analysis is large enough, but we cannot tell for sure about other statistics. Similar words can be said about statistical significance. Moreover, after collecting larger database it is not enough to simply re-run experiments. To proof statistical hypothesis one should make many mathematical calculations to, for instance, choose the most fitting distribution function and apply Pearson's chi-squared test. Of course, in case when dependency is assumed as strong as astrologist prediction, these tests are senseless.
We made this article to find directions where one can look in terms of statistics on error database. If we had spotted significant deviation, we would have thought about this and would have made experiments that are more detailed. However, this was not the case.
0
0
0
0