
Running PVS-Studio in Jenkins
Automating the analyzer run
In order to automate the analysis process in CI (Continuous Integration) you have to run the analyzer as a console application.
In Jenkins you can create one of the following build steps:
- Execute Windows batch command
- Windows PowerShell
- Execute shell
and write the analysis command (and the command to convert the report in the needed format).
Examples of commands to run and integrate the analyzer into build systems are given on the following pages of documentation:
- How to run PVS-Studio on Linux and macOS;
- How to run PVS-Studio on Windows;
- How to run PVS-Studio Java.
Warnings Next Generation plugin
Warnings NG plugin supports PVS-Studio analyzer reports, starting from the plugin version 6.0.0. This plugin is designed to visualize the results of various analyzers.
You can install the plugin from the standard Jenkins repository in the menu Manage Jenkins > Manage Plugins > Available > Warnings Next Generation Plugin:
To publish the analysis results, in project settings, you have to add the post-build step (Post-build Actions section) Record compiler warnings and static analysis results.. Next, you need to open the list Tool and choose PVS-Studio. In the Report File Pattern field you can specify the mask or the path to the analyzer report. Reports with extensions .plog and .xml.are supported.
The Report Encoding field specifies the encoding in which the report file will be read. If the field is empty, the encoding of the operation system in which Jenkins is run, will be used. Fields Custom ID and Custom Name override the identifier and the name of the chosen utility in the interface.
To publish analysis results through pipeline scripts, add the following:
recordIssues enabledForFailure: true,sourceCodeEncoding:'UTF-8',
 tool: PVSStudio(pattern: 'report.plog')
where report.plog is the analyzer report.
Here are some ways to generate a report in the needed format:
Windows: C, C++, C#
Reports with .plog extension are standard for Windows.
Linux/macOS: C, C++
plog-converter ... --renderTypes xml ...Windows/Linux/macOS: Java
In the settings for plugin for Maven and Gradle in the outputType field set the value xml.
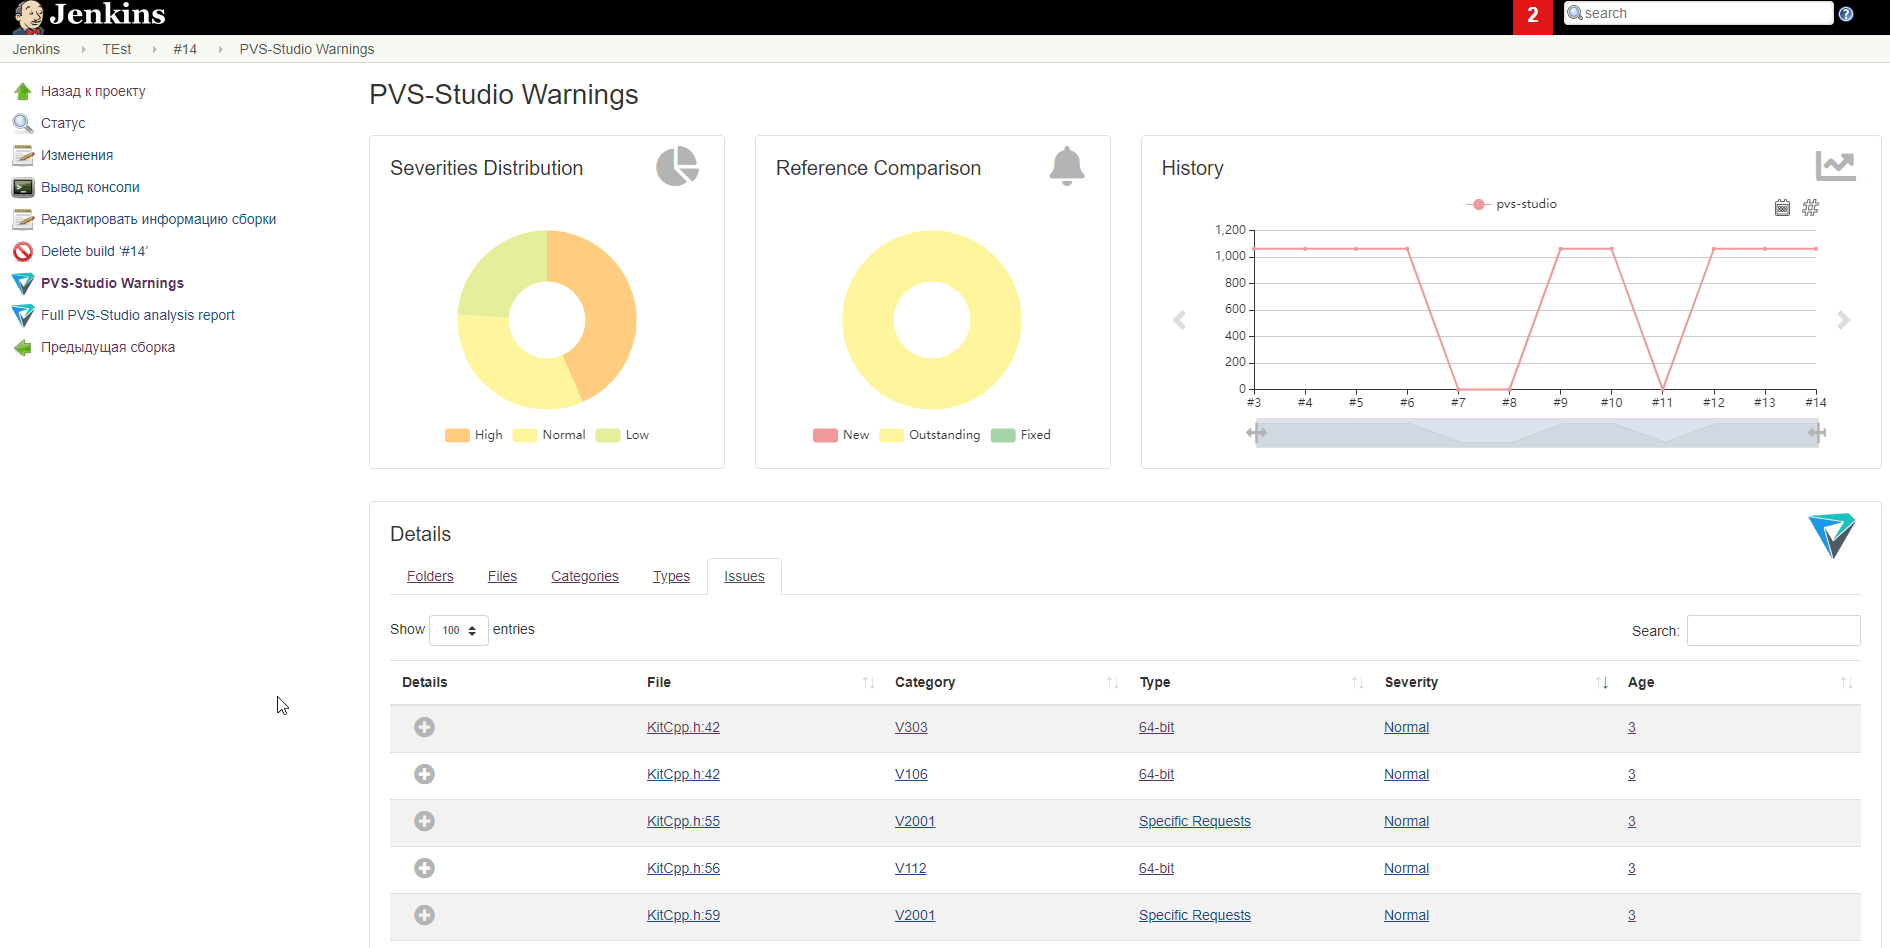
After building the project a new element will appear in the PVS-Studio Warnings menu on the left. Clicking on it opens a page that visualizes data of the report created by the PVS-Studio analyzer:
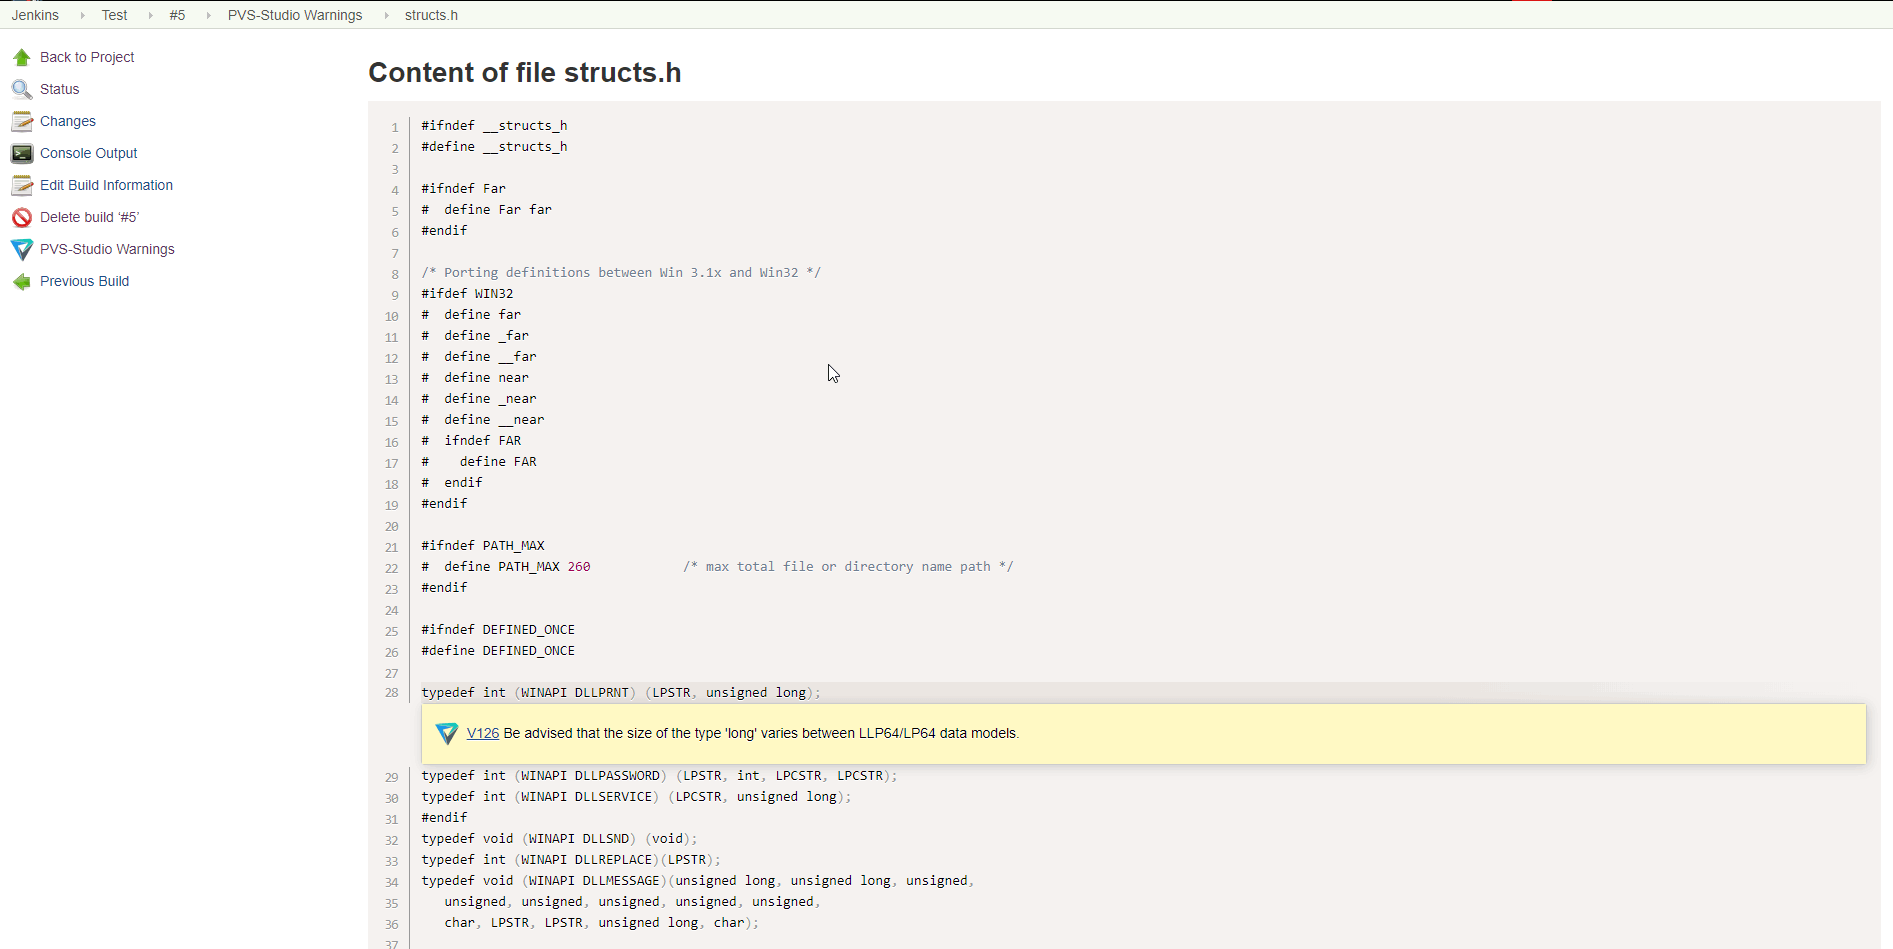
Also, when you click on the value in the File column, the browser will open a source file on the line where the error was found. If the file doesn't open, it means that the report was generated outside the build directory or the files involved in the report have been moved or deleted.
Note. In Jenkins, to view warnings from the uploaded analyzer report in source code files (the links in the File column), the following condition must be met: when starting the Record compiler warnings and static analysis results step (the Post-build Actions section), the project files, whose paths are specified in the analyzer report (*.plog file), should be located in the Jenkins job workspace. The source code files to which the analyzer issued warnings are cached for each build of the Jenkins job. So, after performing the Record compiler warnings and static analysis results step (the Post-build Actions section), you can clear the Jenkins job workspace without losing the ability to view warnings in source code files using Jenkins. If files do not open, then the report was created outside the Jenkins job workspace, or the cached source code files (that were used to create the report) in the Jenkins job build directory have been moved or deleted.
In other CIs, configuration of the analyzer run and handling reports are performed in the same way.
Additional links
- Warnings NG plugin documentation (GitHub);
- Running PVS-Studio in TeamCity;
- PVS-Studio and continuous integration;
- Integrating PVS-Studio analysis results into SonarQube.
Was this page helpful?