How to display the analyzer's most interesting warnings
PVS-Studio analyzer allows a user to easily check out the most interesting warnings. This mechanism helps you start working with the report faster and easier. These warnings are based on our most noteworthy and "dangerous" diagnostic rules of the analyzer. The Best Warnings mode is most likely to report real errors.
Mainly, this mechanism helps learn more about the analyzer's features.
The Best Warnings mode does not substitute work with the analyzer full report. The full report may contain messages about potential errors, which also require attention.
How it works
The most interesting warnings are selected according to a number of criteria called weights. Each diagnostic has an initial weight. This weight reflects the probability of the diagnostic to detect a significant (meaningful) error. We assigned the weights to the diagnostics in accordance with our extensive experience with static analysis and statistics we gathered when analyzing various projects. When we adjust these weights, we take into account the following:
- the warning level;
- the file name and directory name. We look for keywords indicating that the analyzer issued a warning for tests;
- how frequent the same diagnostics appear in the project. It helps reduce the number of monotonous warning types;
- the number of warnings issued per line of the same file.
As a result, we get a list of "warning-weight" pairs. From this list, the mechanism filters no more than ten "heavy" warnings.
Visual Studio (C, C++, and C#)
The PVS-Studio plugin for Microsoft Visual Studio is conveniently integrated into the IDE. This plugin allows you to run the analysis of the entire solution, specific projects, or individual files. It also supports incremental analysis.
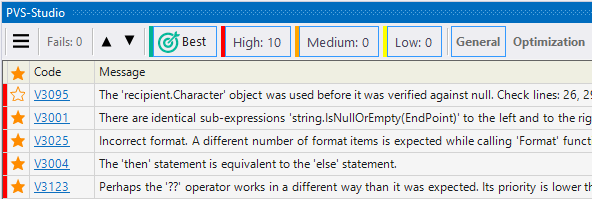
You can review the most interesting warnings in the Visual Studio's special window that provides analysis results:
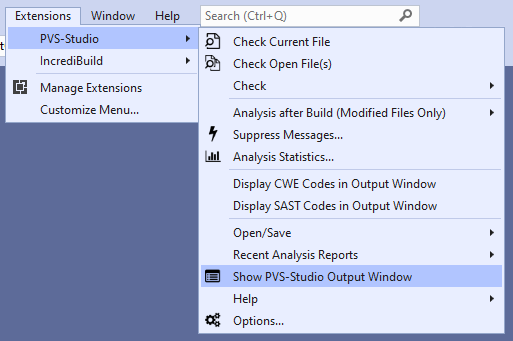
This window appears automatically, for example, when you run a project analysis. If you need to display it manually, then use the PVS-Studio extension settings:
The window itself allows you to navigate through the warnings that the analyzer found. It also allows you to navigate to the code that needs to be fixed. The window also provides advanced filtering and sorting capabilities for you to analyze the results most efficiently. Additionally, you can quickly go to the documentation of selected diagnostics.
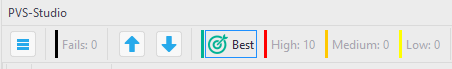
To display the best warnings, click on the 'Best' button.
As a result, the window shows only the Best Warnings. If you click again, the window shows all the errors that the analyzer found.
IntelliJ IDEA, Rider and CLion
Starting with PVS-Studio 7.22, the Best Warning mechanism is supported by Rider, IntelliJ IDEA, and CLion plugins. To check out the analyzer's most interesting warnings, click on the 'Best' button, as shown in the screenshot below:
After that, the table with the results of the analysis will show maximum of ten of the most critical warnings of the analyzer. If you click again, the window will show all the errors that the analyzer found.
Additional links
If you are new user, we also recommend reading the following articles:
- Suppression of false positive warnings
- Tips on speeding up PVS-Studio
- PVS-Studio: troubleshooting
- Additional diagnostics configuration
- Incremental analysis mode in PVS-Studio
Was this page helpful?